Research interests

The Arctic warms several times faster than the global mean. Within (AC)³ I study how sea ice, leads and clouds shape the surface energy budget.

Most of my fieldwork happens between Svalbard, the Fram Strait and northern Scandinavia, where warm Atlantic air meets the sea ice. These are the bases I have worked from.
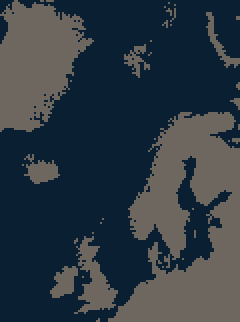
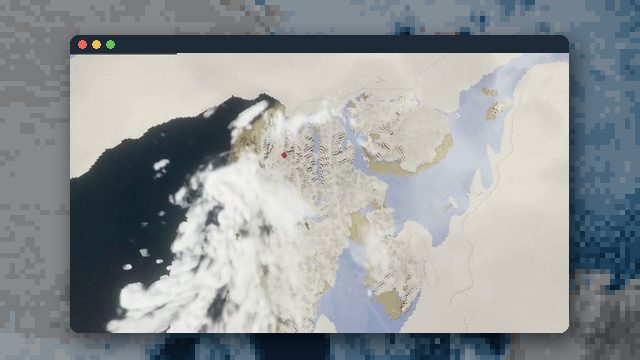
today's intro scene
GreenlandIcelandSvalbardFram StraitScandinavia Leipzig, home institute

COMPEX 2026 · Longyearbyen

  • Low cloud streaming over the sea ice, seen from Polar 5
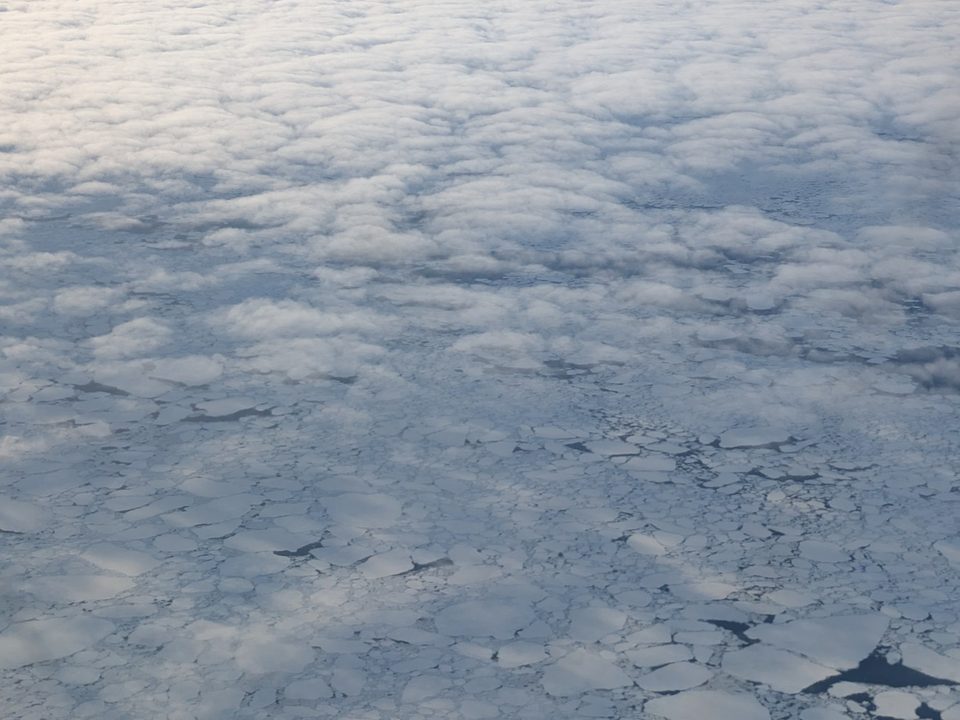
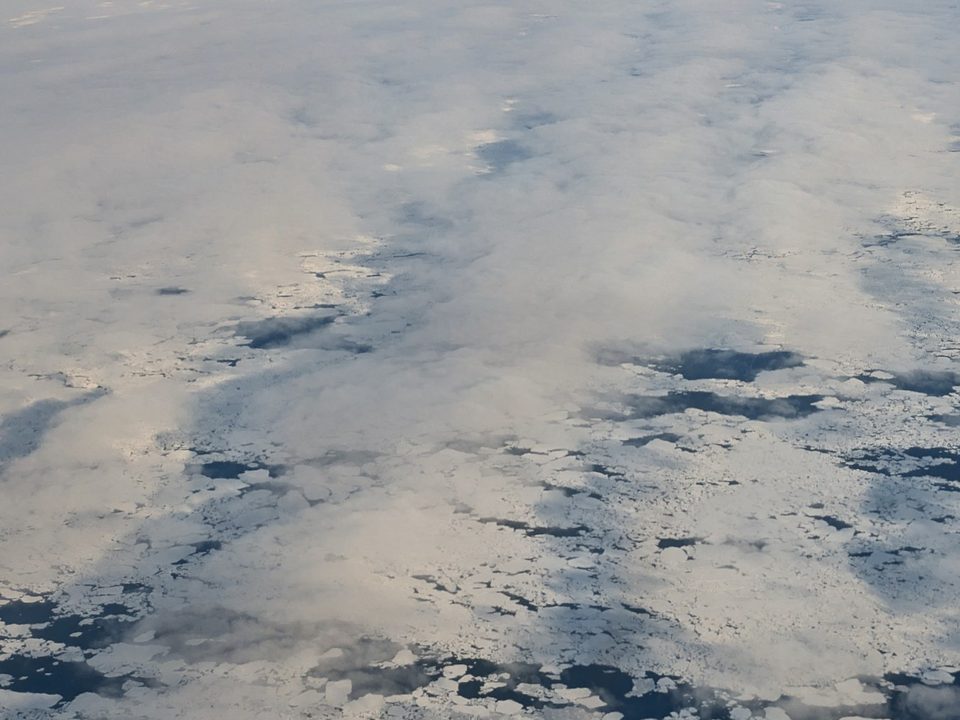
  • A cloud deck above broken sea ice

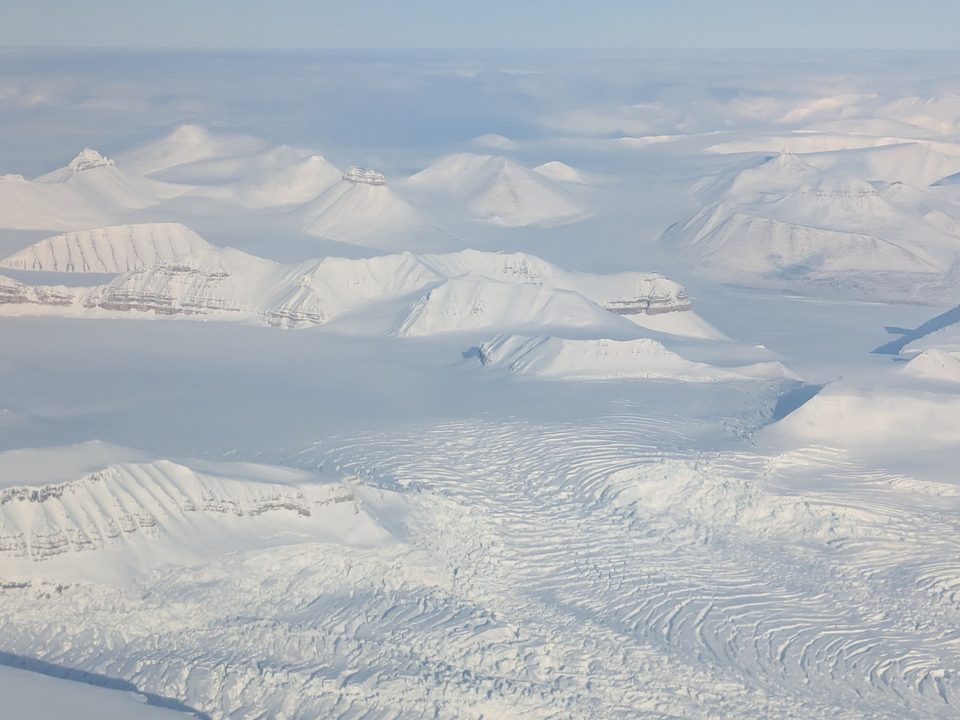
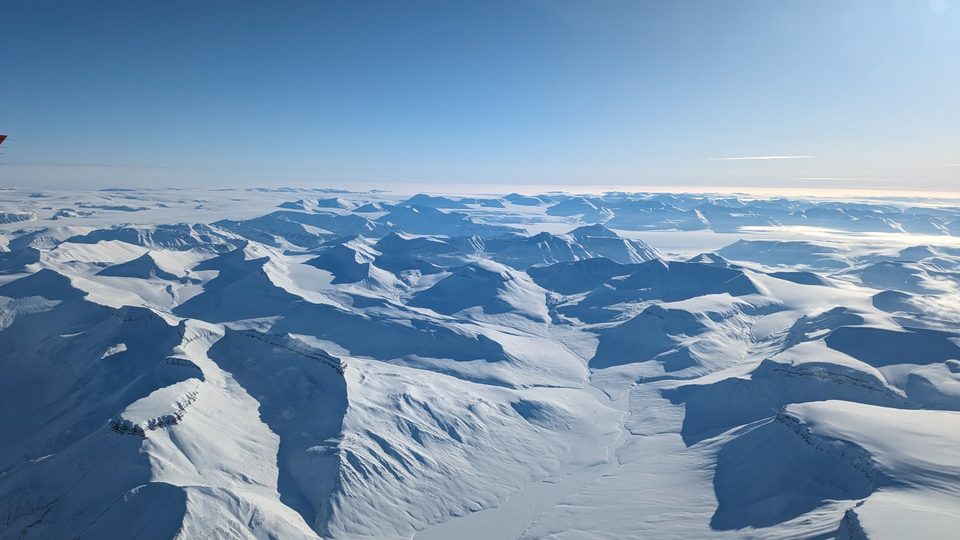
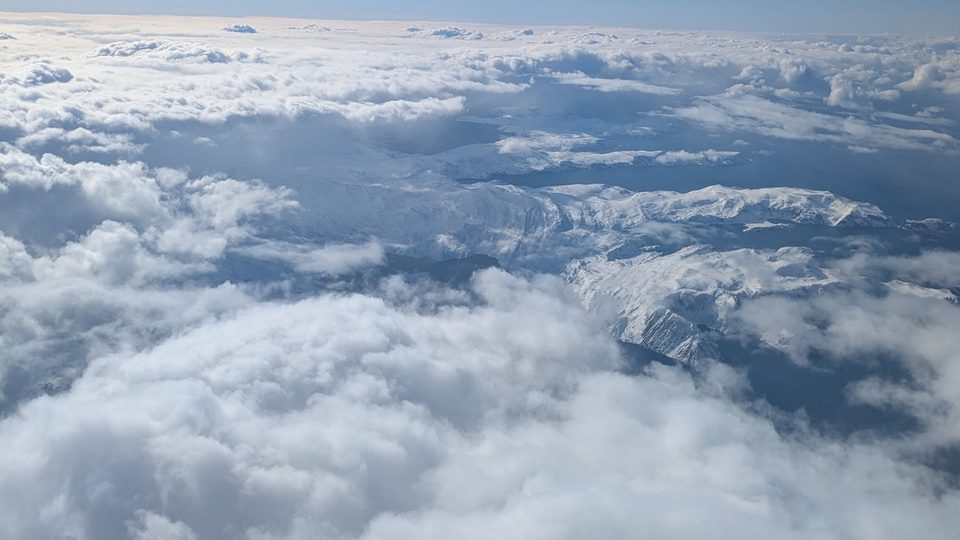
  • Glaciers and snowy mountains from the air

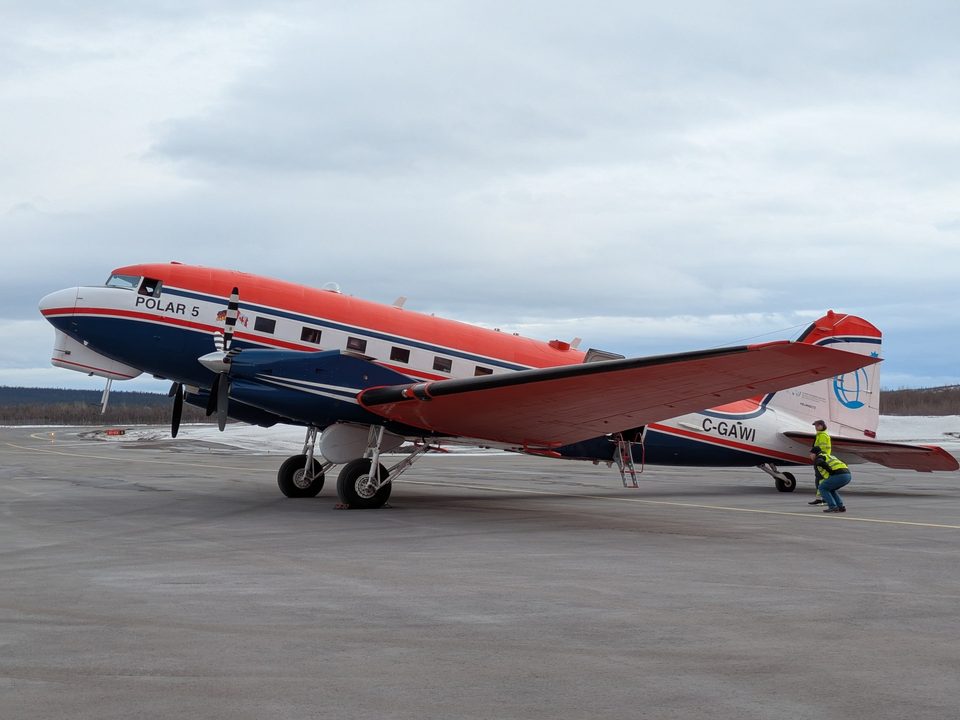
  • Polar 5 on the apron in Longyearbyen

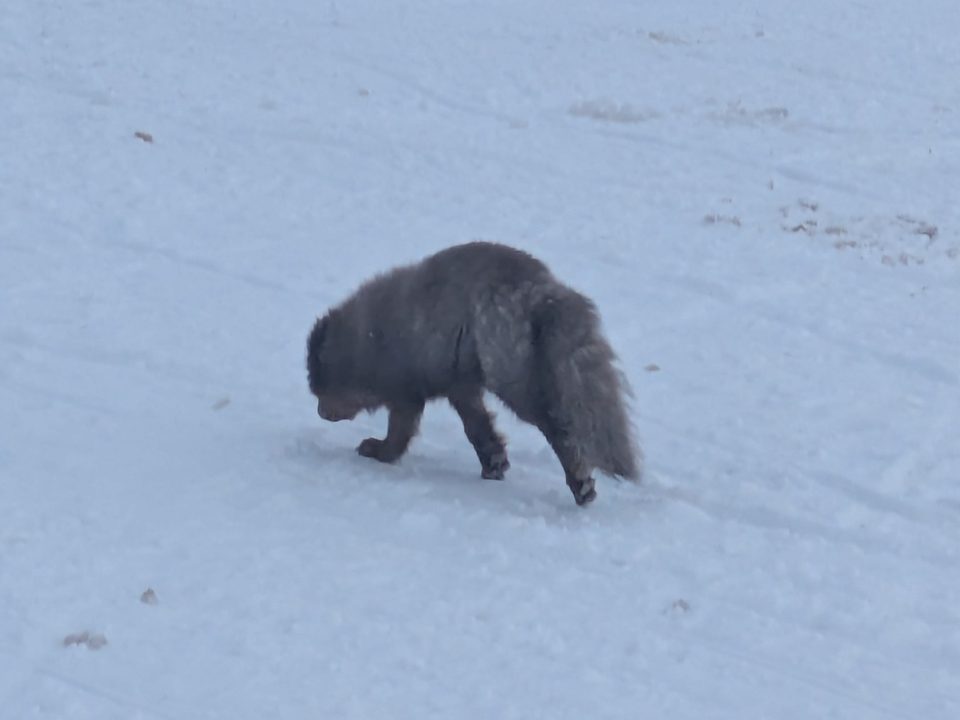
  • ☺ fun Ground crew doing its rounds: an Arctic fox inspecting the snow

1 / 5

COMPEX-EC 2025 · Kiruna

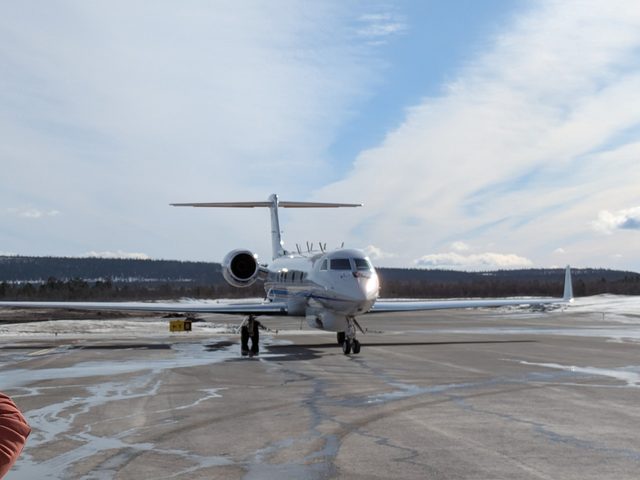
  • Polar 5 on the apron in Kiruna

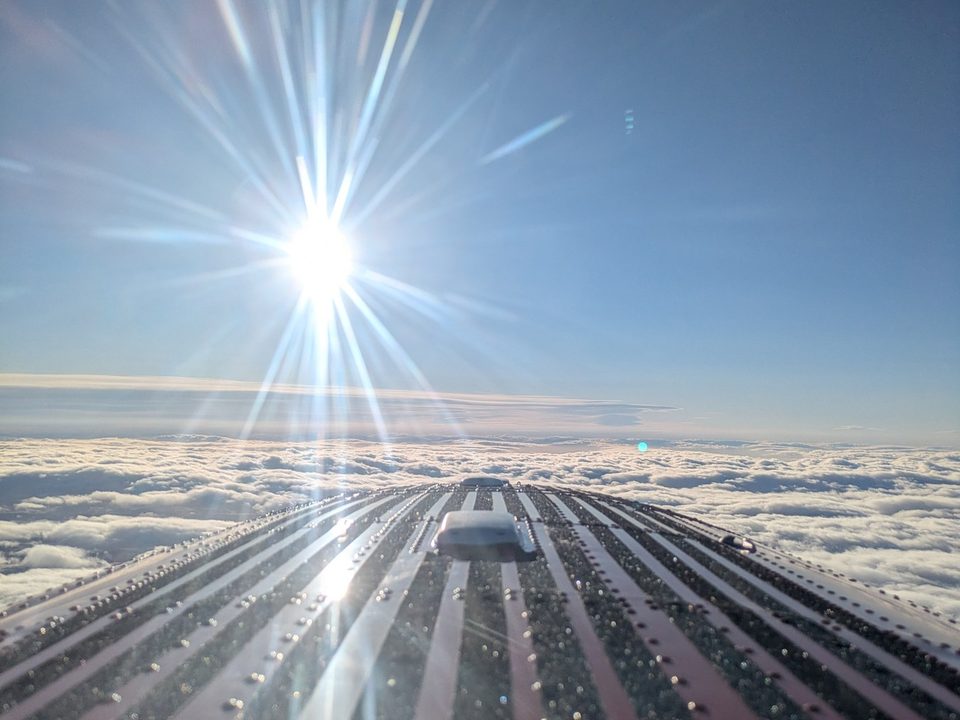
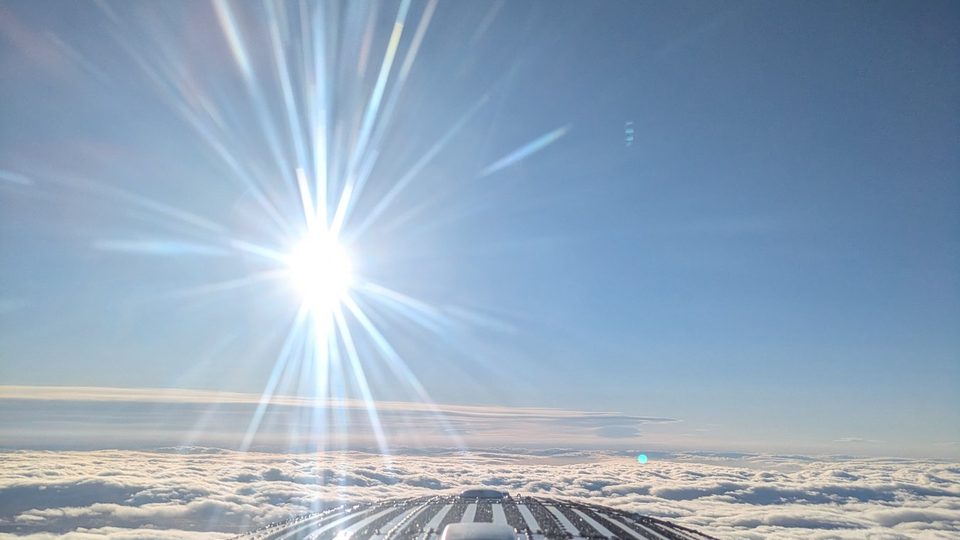
  • Sun above the cloud deck on a flight from Kiruna

  • Flying over Lapland near Kiruna

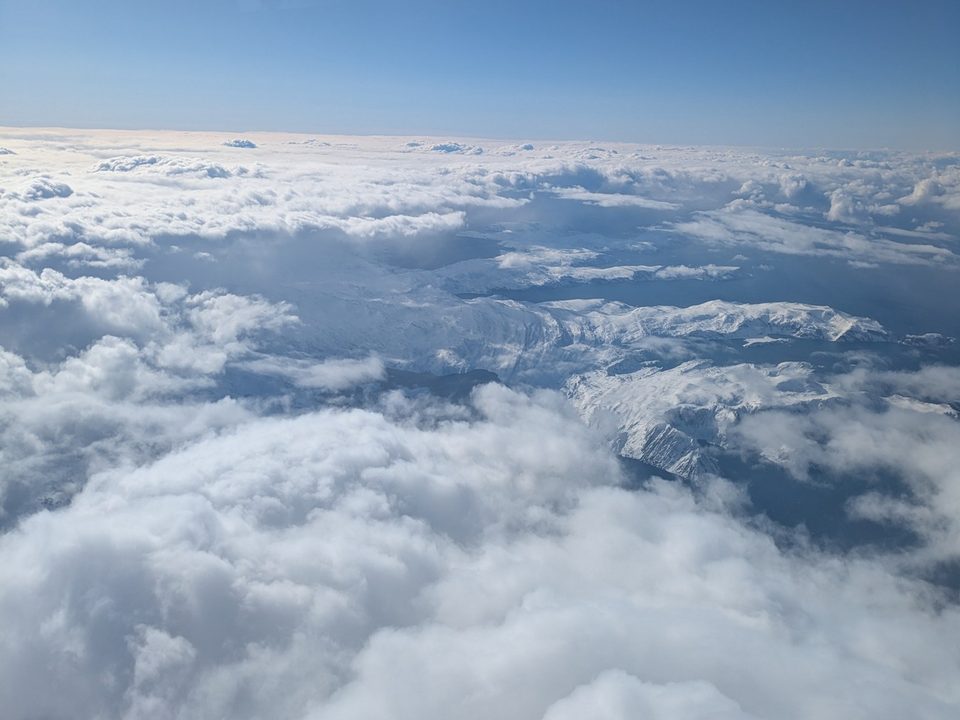
  • Snowy mountains and a fjord showing through the cloud deck
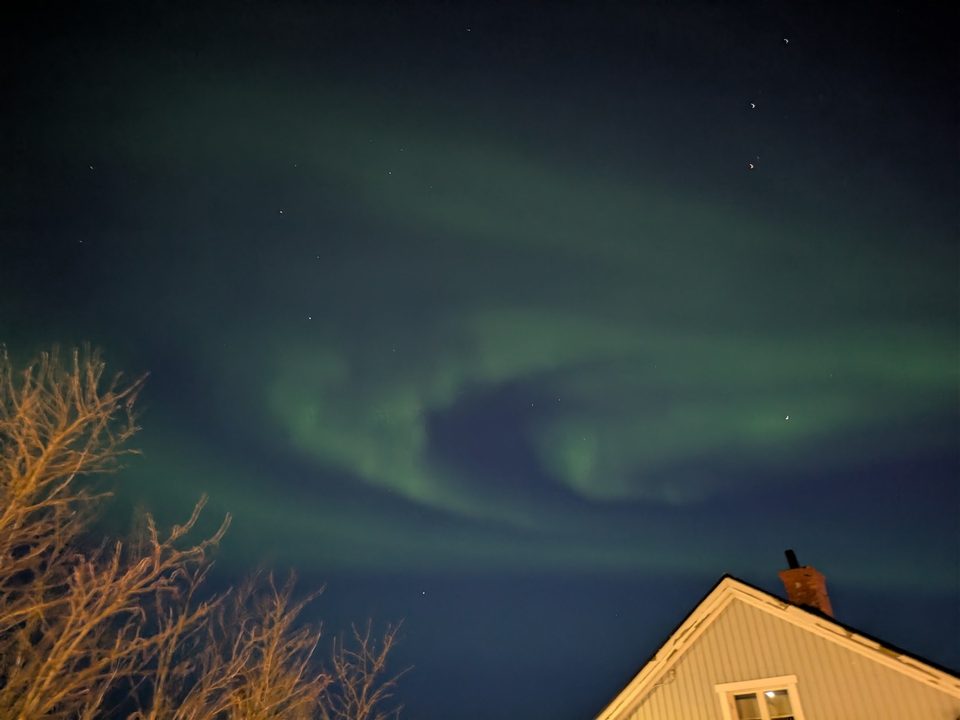
  • ☺ fun After the flight is before the aurora: who needs sleep in Kiruna?

1 / 5

AIDA 2024 · Ny-Ålesund

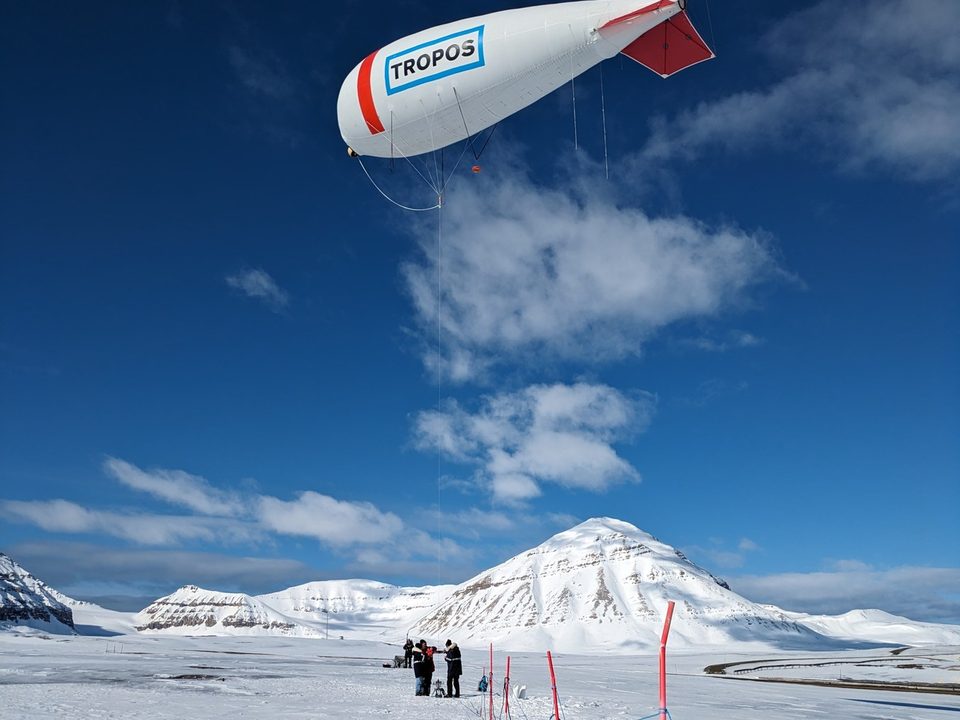
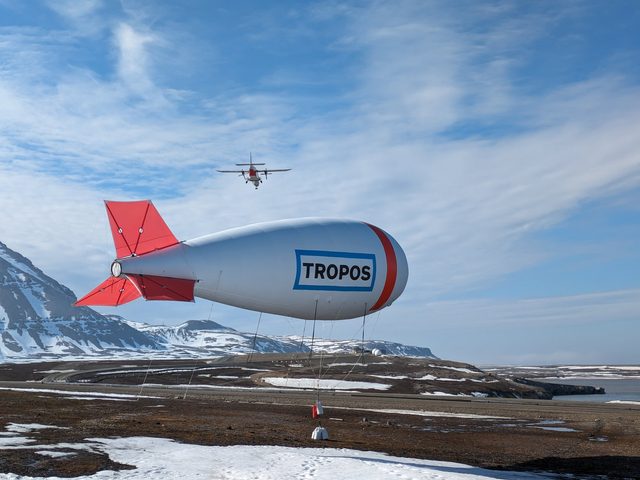
  • BELUGA on its tether above the snow at Ny-Ålesund
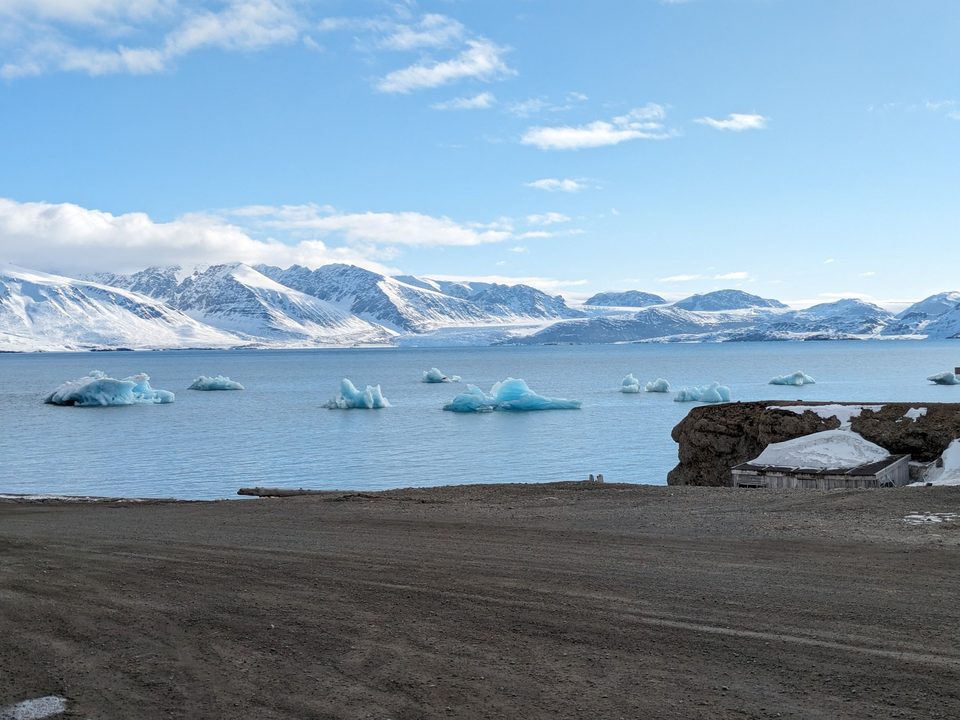
  • Icebergs in the fjord at Ny-Ålesund

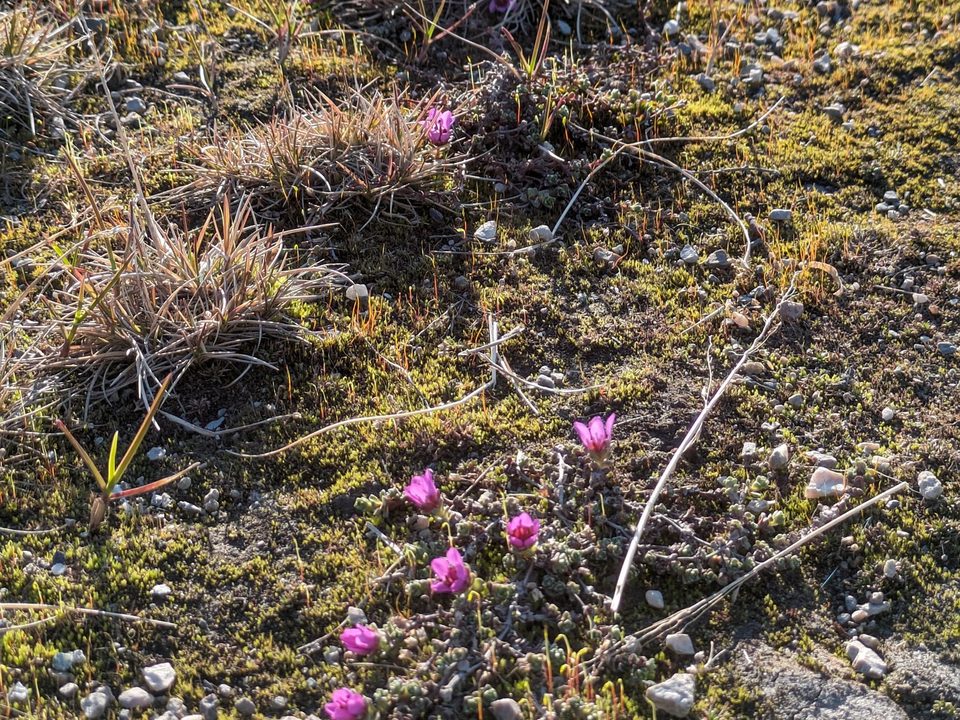
  • First flowers on the tundra in June

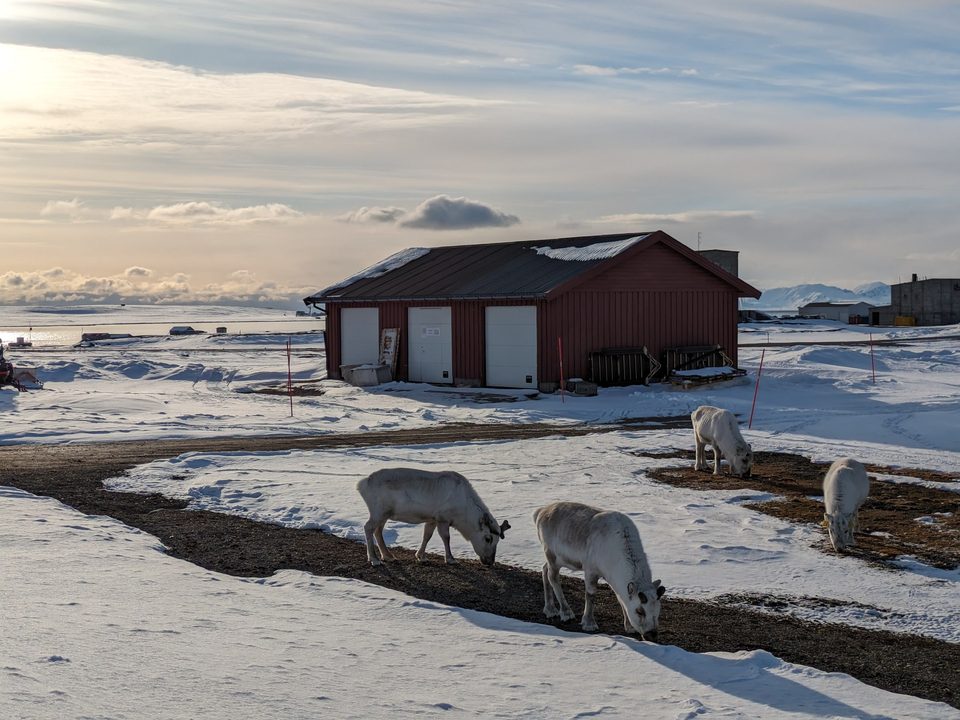
  • Svalbard reindeer grazing next to a hut
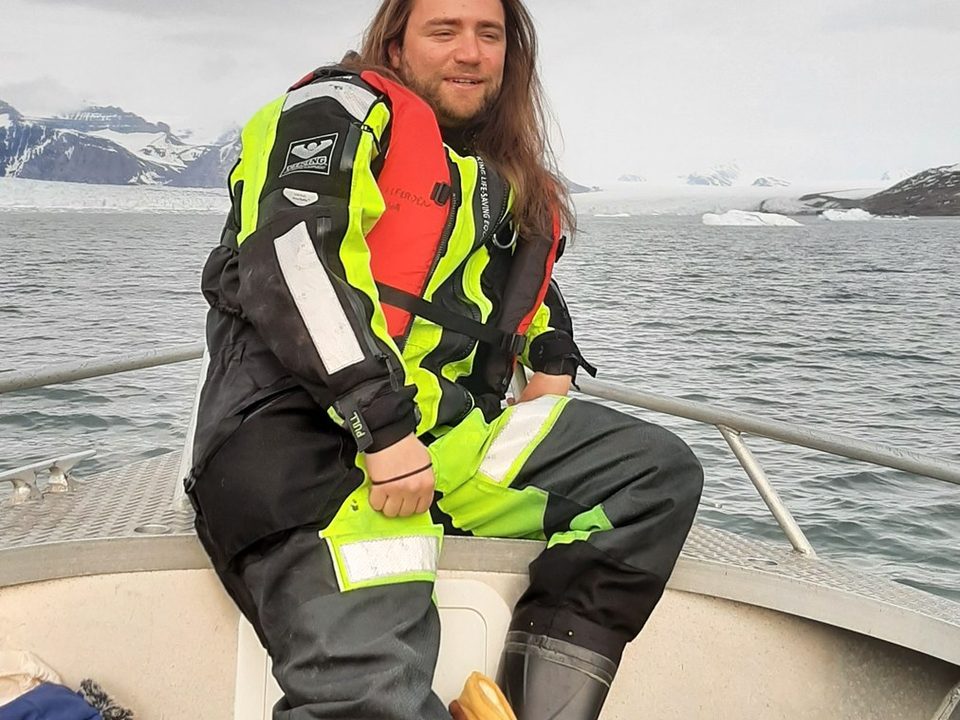
  • ☺ fun Some days the commute is by boat, survival suit included

1 / 5

BACSAM-II 2024 · Longyearbyen

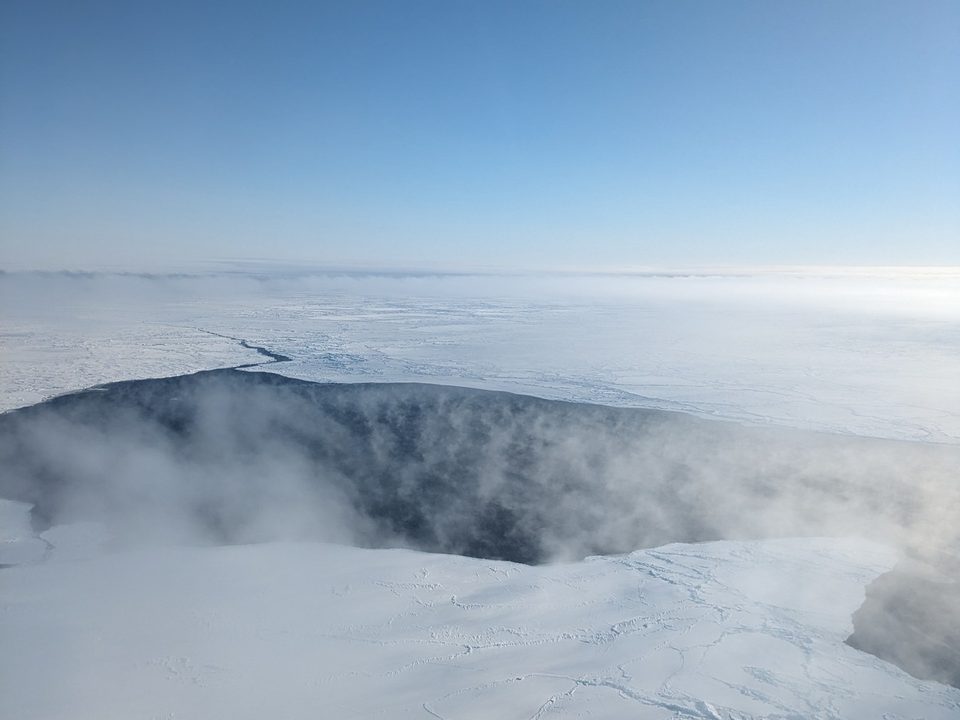
  • Sea smoke over a lead: open water steaming into the cold air
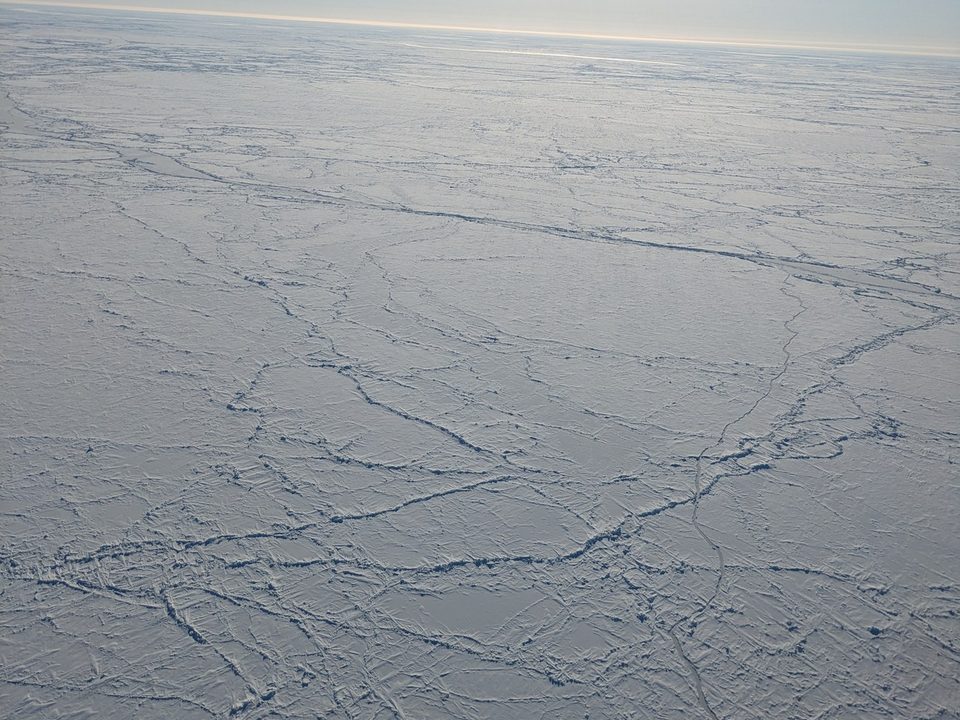
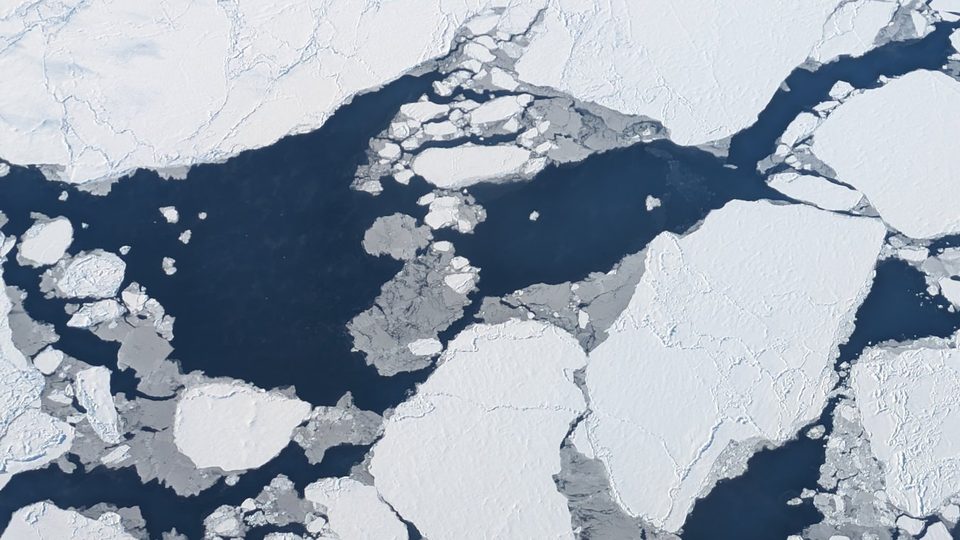
  • Cracks across the pack ice

  • Flying over the mountains of northwest Svalbard
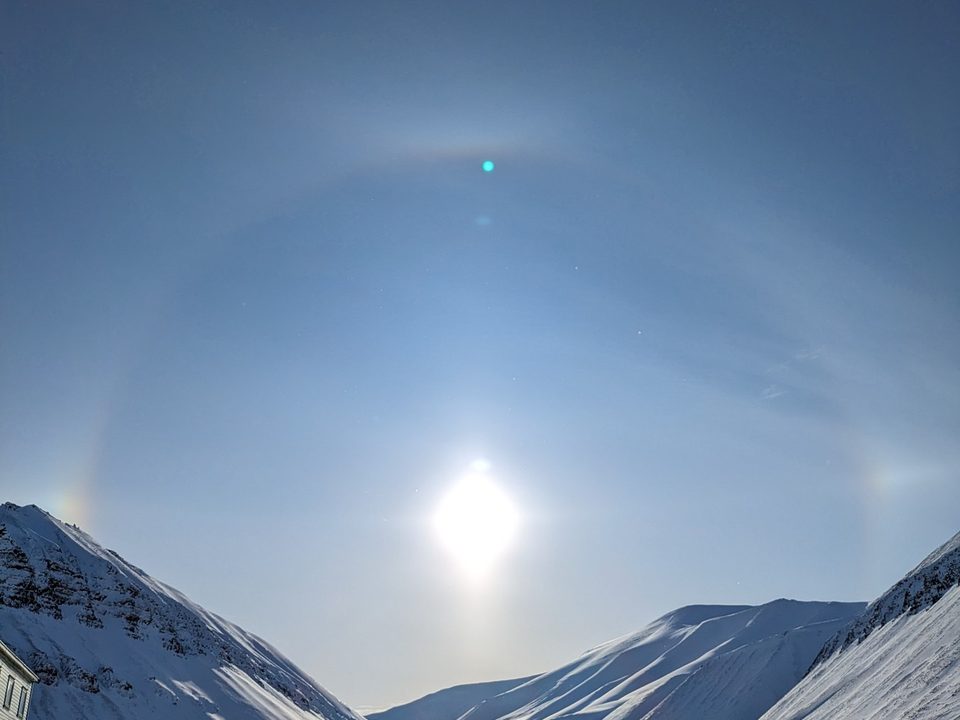
  • A halo around the sun: light refracted by ice crystals in the air
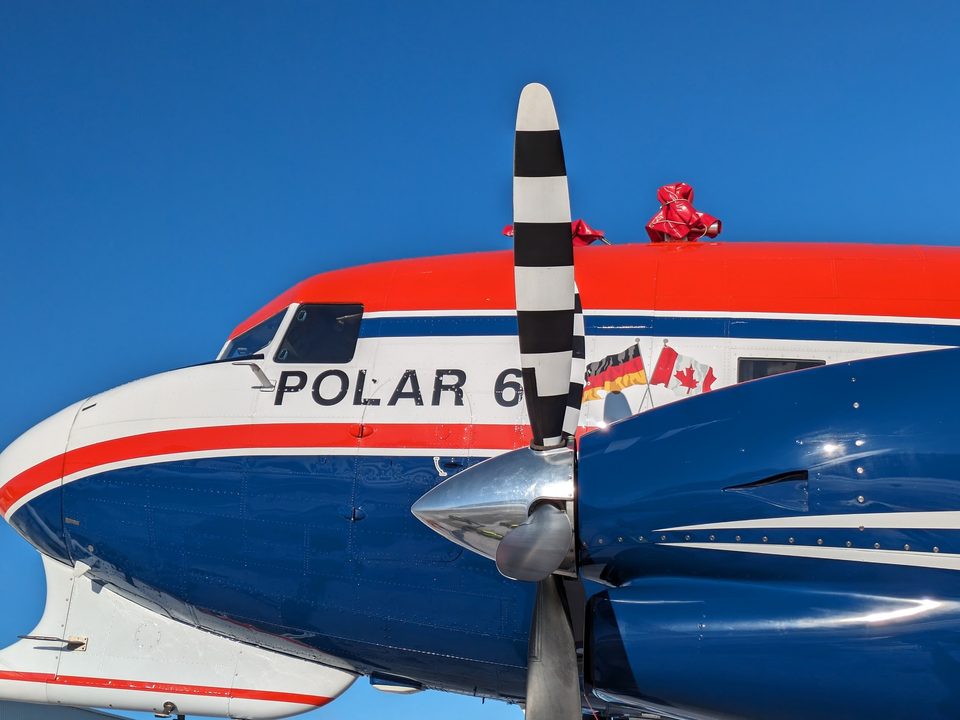
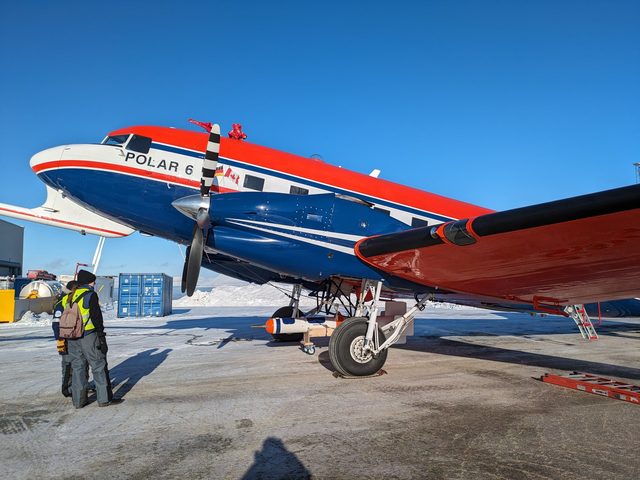
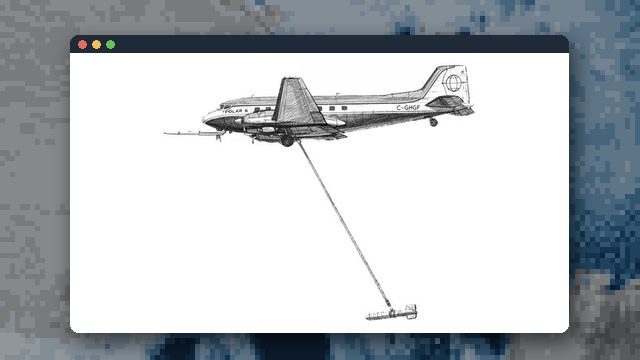
  • ☺ fun Our ride: Polar 6, a Basler BT-67 rebuilt from a 1940s DC-3. Older than everyone on board.

1 / 5

From Leipzig to the sea ice. The framed box is today's intro scene in its true place. Pick a base or a campaign to see its photos.

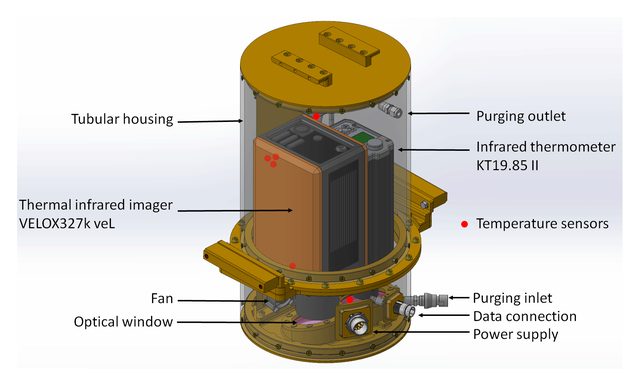
Research flights with Polar 5 and Polar 6, plus tethered-balloon profiles. With the thermal infrared imager VELOX I map surface skin temperature and surface type.

From an aircraft we can follow an air mass as it leaves the sea ice and see the clouds and the surface below at the same time. On campaigns I plan the flights and run the instruments on board.

Polar 5 AWI's Basler BT-67 with radar, lidar, spectral and broadband radiation instruments and dropsondes (COMPEX, COMPEX-EC).

Polar 6 + T-Bird Low-level flights over the sea ice with the towed T-Bird probe (BACSAM-II).

HALO The high-altitude research aircraft; its VELOX images from HALO-(AC)³ are the data of my first paper as first author.

BELUGA TROPOS tethered balloon for profiles of roughly the lowest kilometre of the atmosphere (AIDA).

VELOX Six-channel thermal infrared camera (7.7-12 µm) that maps surface and cloud temperature at about 10 m resolution from 10 km altitude.

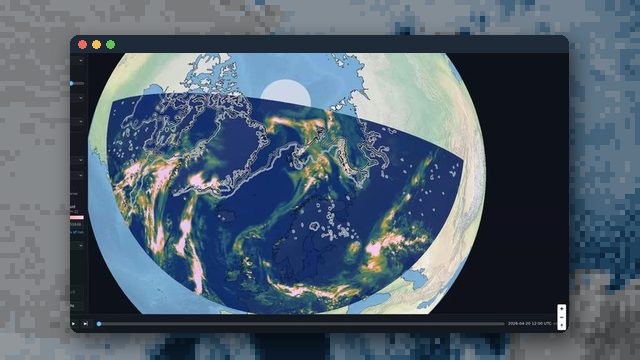
MODIS, VIIRS and Sentinel data put the flights into context. I turn them into sea-ice and lead fields for the ICON model and compare aircraft data with EarthCARE.

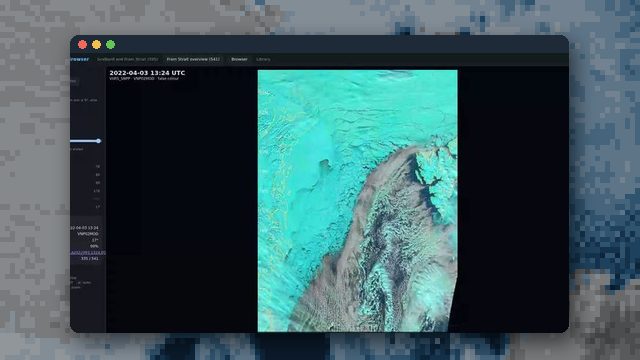
Near 80° N the polar orbiters converge. My swath archive keeps every overpass that touches the box instead of one image a day, so the Fram Strait is usually seen every few minutes, with gaps of up to about an hour.

12satellites, 7 instrument families
≈160published looks a day over the Fram Strait (15 Mar to 15 Apr 2026)
52 minlongest gap between looks that day
VIIRS
MODIS
AVHRR
SLSTR
SGLI
MSI
000306091215182124
Every published look over the Fram Strait box on one day, by instrument (UTC). Hover or tap a tick for satellite and time. (2026-04-04, 172)
  1. Fetch the swaths from NASA, EUMETSAT, Copernicus, JAXA and ESA
  2. Regrid each overpass on its own: one time step per granule, never a composite
  3. Check against physics and against the other sensors
  4. Publish as a browser you can scrub through

Open the satellite browser →

Clouds strongly shape the heat budget of the Arctic surface. On campaigns we measure them from the aircraft, while EarthCARE and other satellites look from above.

Clouds strongly shape the heat budget of the Arctic surface, so they come with every surface measurement. On campaigns we sample them from the aircraft, and I contribute to my colleagues' cloud studies.

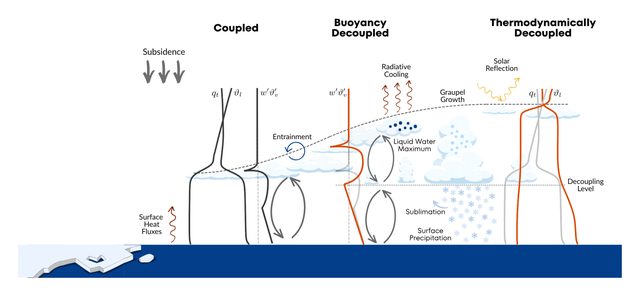
How a cold-air outbreak cloud layer couples and decouples (Paulus et al. 2026, Fig. 13, CC BY 4.0)

EarthCARE, launched in 2024, carries a cloud radar, a lidar, an imager and a broadband radiometer. During COMPEX-EC we flew Polar 5 along its ground track to compare it with airborne measurements in marine cold-air outbreaks. On the first flight Polar 5 itself showed up as a dot in EarthCARE's radar (Uni Köln blog).

Open the MSS forecast explorer →

Explore