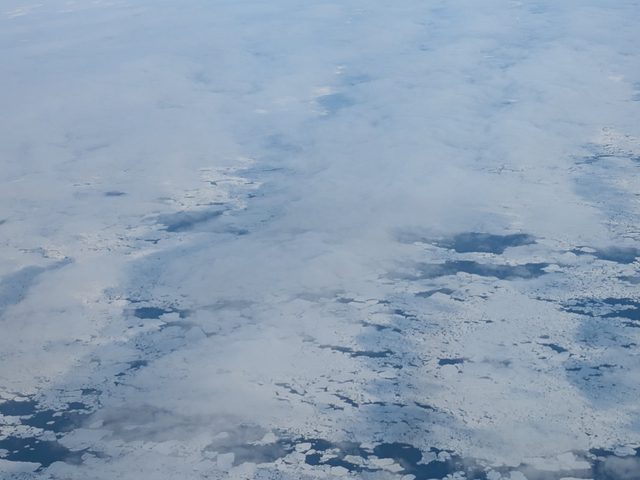
2026 COMPEX
Polar 5 · Svalbard: Ny-Ålesund, marginal ice zone
Flight planning, scientific instrument operation
2026 COMPEX
Polar 5 · Svalbard: Ny-Ålesund, marginal ice zone
Flight planning, scientific instrument operation
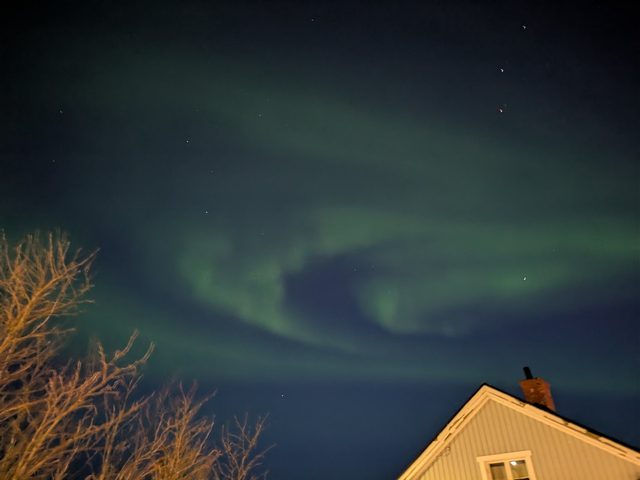
2025 COMPEX-EC
Polar 5 · North of Scandinavia, Norwegian Sea (EarthCARE underflights from Kiruna)
Flight planning, scientific instrument operation
Blog (Uni Köln) · Polar 5 in EarthCARE's radar · ESA Campaign Earth
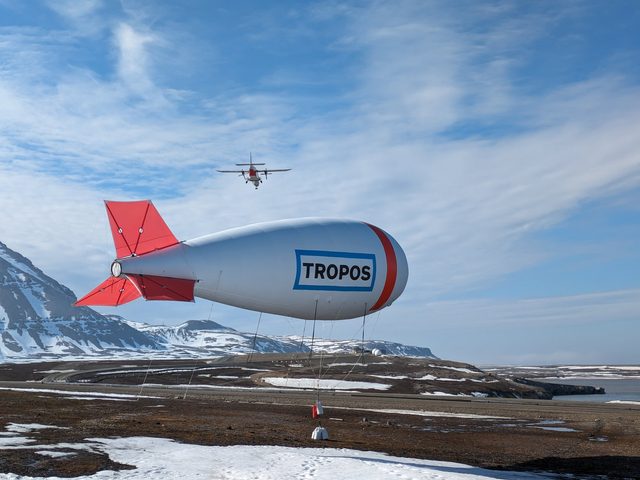
2024 AIDA
Tethered balloon BELUGA · Ny-Ålesund, Svalbard
Weather forecasting, balloon handling, measurements
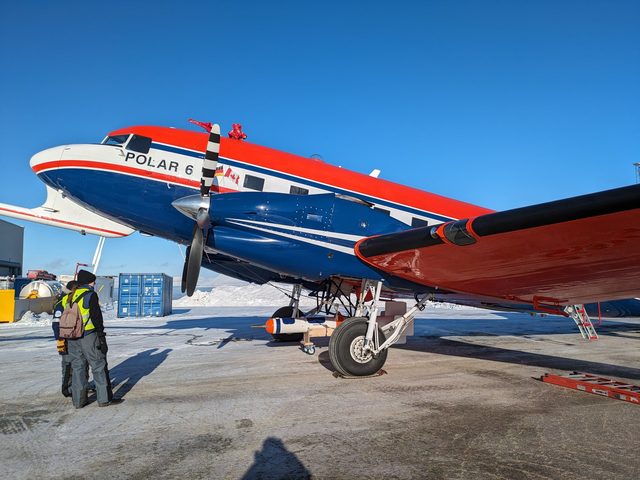
2024 BACSAM-II
Polar 6, T-Bird · Svalbard and north of Greenland
Flight planning
Simon et al. 2025, GRL · Simon et al. 2026, EGUsphere (in review)
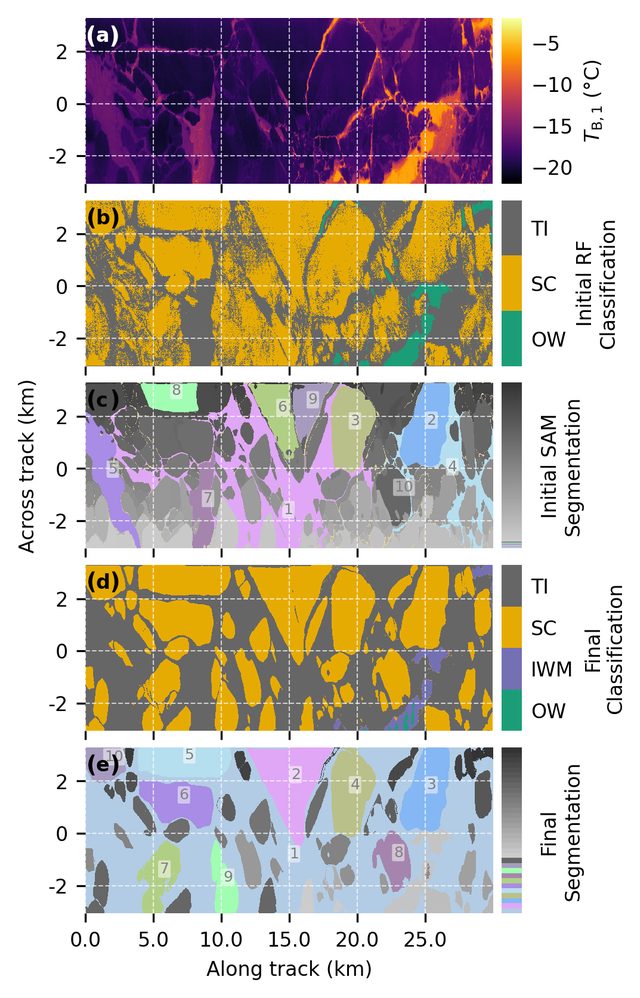
Müller, J., Schäfer, M., Rosenburg, S., Ehrlich, A., Wendisch, M. (2025). High-resolution maps of Arctic surface skin temperature and type retrieved from airborne thermal infrared imagery collected during the HALO–(AC)³ campaign. Atmospheric Measurement Techniques, 18(18), 4695-4708. doi:10.5194/amt-18-4695-2025
With the thermal camera VELOX on board HALO, we mapped the surface temperature and surface type of Arctic sea ice pixel by pixel; the temperatures agree with MODIS within 2 K.
Fig. 7: Müller et al. (2025), CC BY 4.0
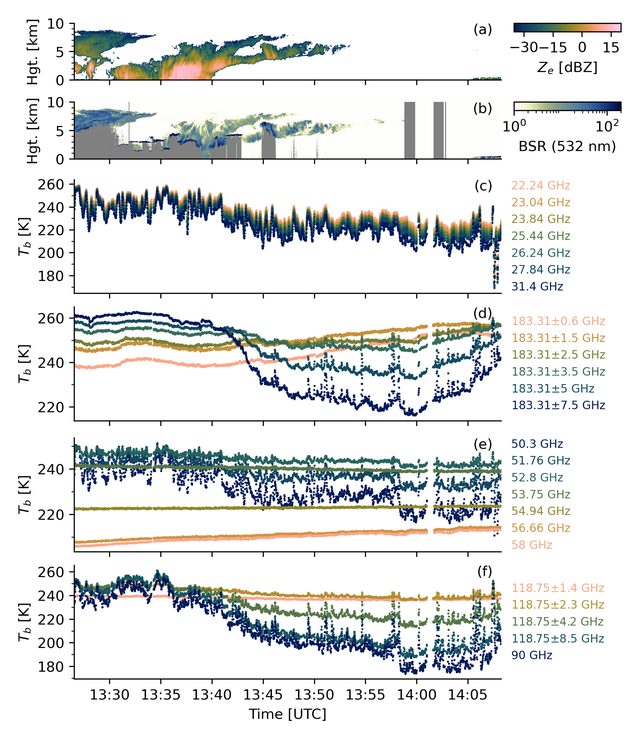
Risse, N., Mech, M., Prigent, C., Müller, J., Crewell, S. (2026). Cloud liquid water path detectability and retrieval accuracy from airborne passive microwave observations over Arctic sea ice. Atmospheric Measurement Techniques, 19(6), 2197-2223. doi:10.5194/amt-19-2197-2026
How well do microwave radiometers see liquid water in clouds over sea ice? In the central Arctic from about 50 g per square metre; towards the ice edge the threshold rises to about 350.
Fig. 2: Risse et al. (2026), CC BY 4.0
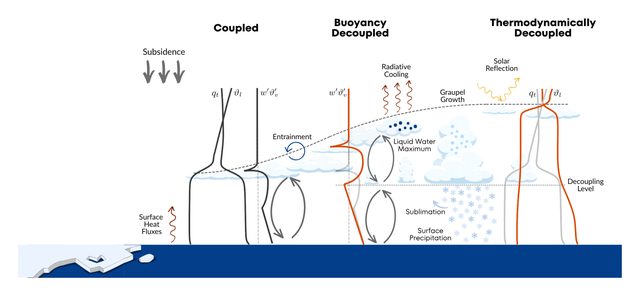
Paulus, F., Müller, J., Kirbus, B., Sodemann, H., van Gelder, L., Walbröl, A., Wendisch, M., Neggers, R. (2026). Impacts of mesoscale atmospheric subsidence on cloud glaciation and decoupling in Arctic marine cold air outbreaks. Atmospheric Chemistry and Physics, 26(19), 13983-14014. doi:10.5194/acp-26-13983-2026
A large-eddy simulation of a cold-air outbreak over the Fram Strait shows that weaker sinking motion lets the boundary layer grow deeper and the clouds turn to ice sooner.
Fig. 13: Paulus et al. (2026), CC BY 4.0
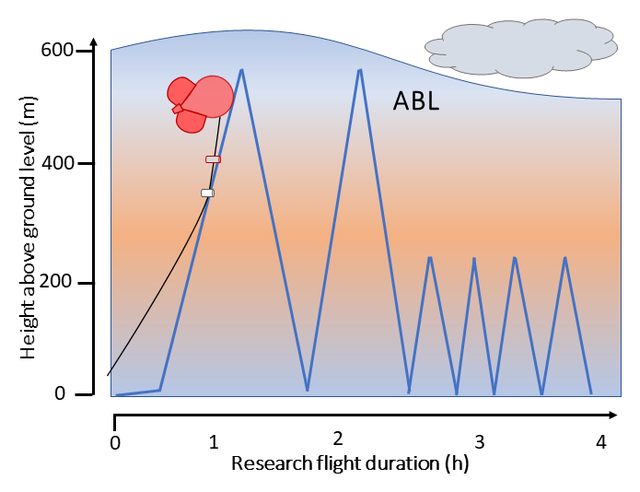
Dorff, H., Siebert, H., Navale, K., Ehrlich, A., Müller, J., Schäfer, M., Wu, F., Wendisch, M. (2026). Tethered balloon-borne measurements to characterise the evolution of the Arctic atmospheric boundary layer at the Villum Research Station. Earth System Science Data, 18(4), 2799-2817. doi:10.5194/essd-18-2799-2026
Twenty-eight tethered-balloon flights with more than 300 profiles at Villum Research Station in Greenland track how the lowest few hundred metres of the atmosphere change as polar night turns into polar day.
Fig. 3: Dorff et al. (2026), CC BY 4.0
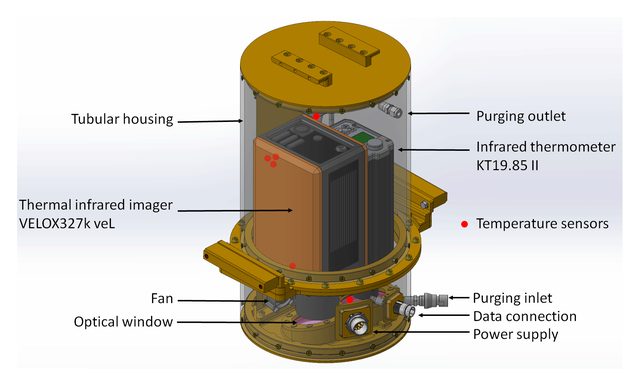
Schäfer, M., Wolf, K., Ehrlich, A., …, Müller, J., et al. (2022). VELOX – a new thermal infrared imager for airborne remote sensing of cloud and surface properties. Atmospheric Measurement Techniques, 15(5), 1491-1509. doi:10.5194/amt-15-1491-2022
VELOX, a six-channel thermal infrared camera adapted for research aircraft, sees clouds and surfaces at about 10 m resolution from 10 km altitude, after careful calibration.
Fig. 1: Schäfer et al. (2022), CC BY 4.0